Senolytic therapy for age-related neurodegeneration
Research Question
“What are the mechanisms underlying senolytic therapy for age-related neurodegeneration?”
ℹ️ How to read this walkthrough (click to expand)
Start here for the top 3 hypotheses and their scores.
Four AI personas debated the question. Click “Read full response” to expand.
Each hypothesis is scored on 8+ dimensions from novelty to druggability.
Interactive network of molecular relationships. Drag nodes, scroll to zoom.
Analysis Journey
Key Findings
## Mechanistic Overview Senescent Cell Mitochondrial DNA Release starts from the claim that modulating CGAS/STING1/DNASE2 within the disease context of neurodegeneration can redirect a disease-relevan
Score: 0.74## Mechanistic Overview Senescence-Induced Lipid Peroxidation Spreading starts from the claim that modulating GPX4/SLC7A11 within the disease context of neurodegeneration can redirect a disease-releva
Score: 0.73## Mechanistic Overview Senescence-Associated Myelin Lipid Remodeling starts from the claim that modulating PLA2G6/PLA2G4A within the disease context of neurodegeneration can redirect a disease-releva
Score: 0.73How This Analysis Was Created
An AI agent scanned recent literature to identify under-explored research questions at the frontier of neuroscience.
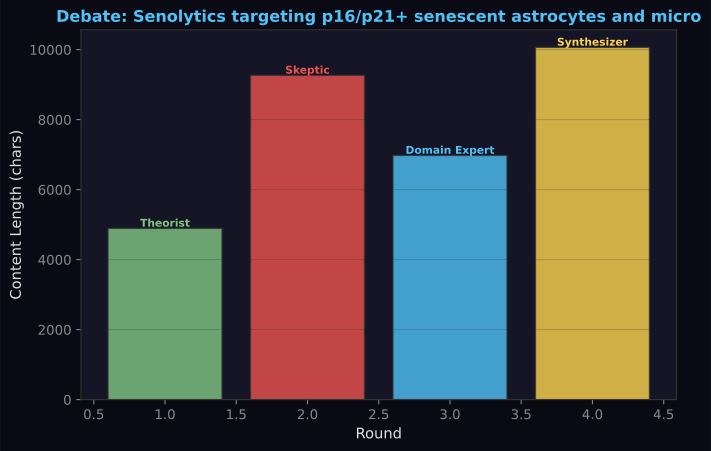
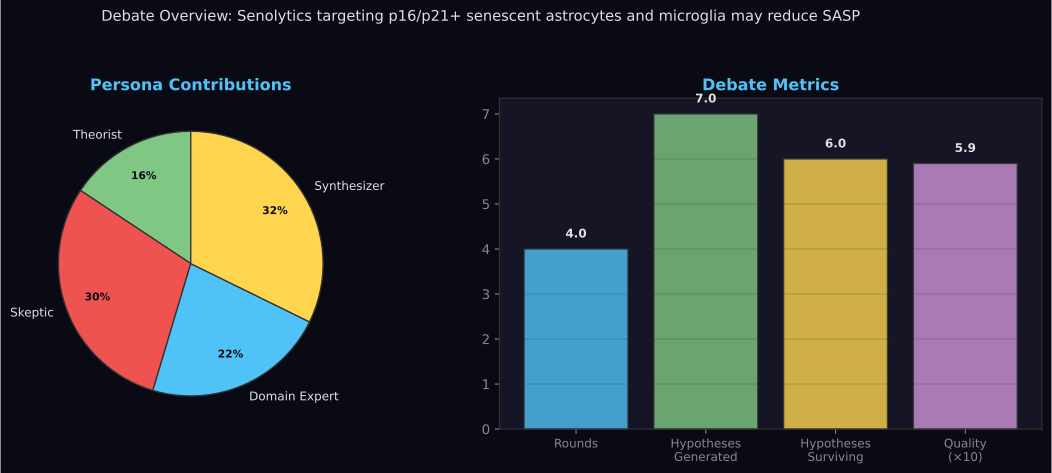
Four AI personas (Theorist, Skeptic, Domain Expert, Synthesizer) debated the question across 4 rounds, generating and stress-testing hypotheses.
Each hypothesis was evaluated against PubMed literature, clinical trial data, and gene expression databases to build an evidence portfolio.
379 molecular relationships were extracted and mapped into an interactive knowledge graph connecting genes, pathways, and diseases.
Executive Summary
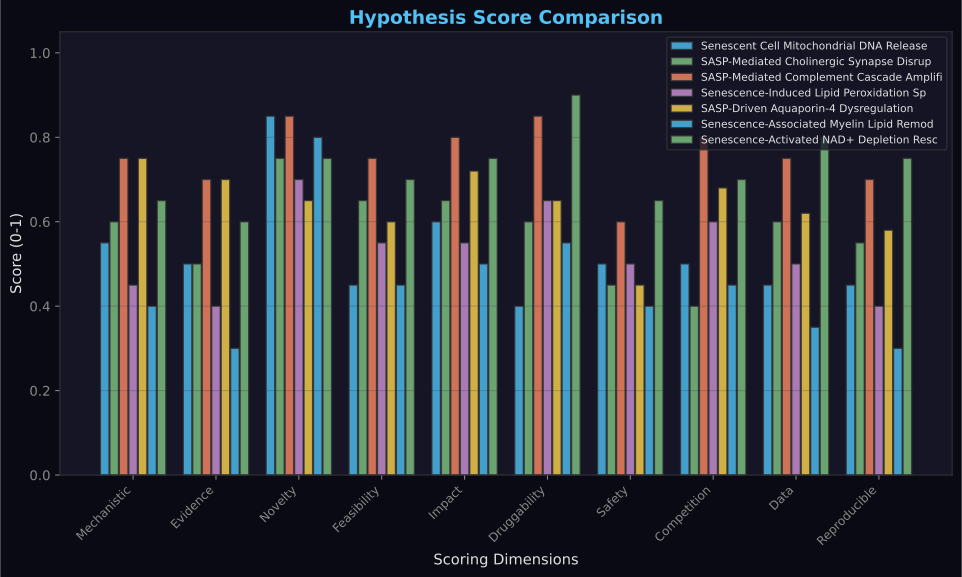
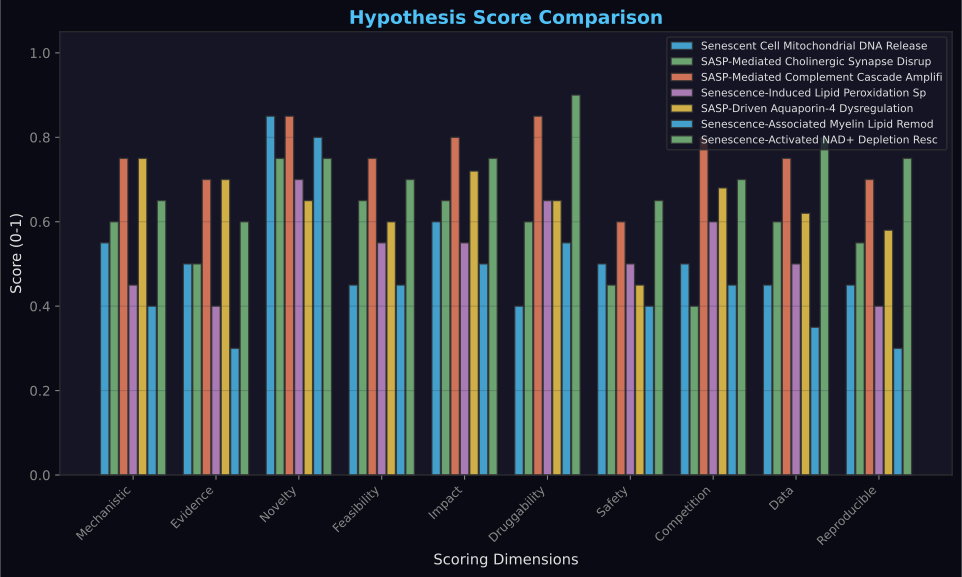
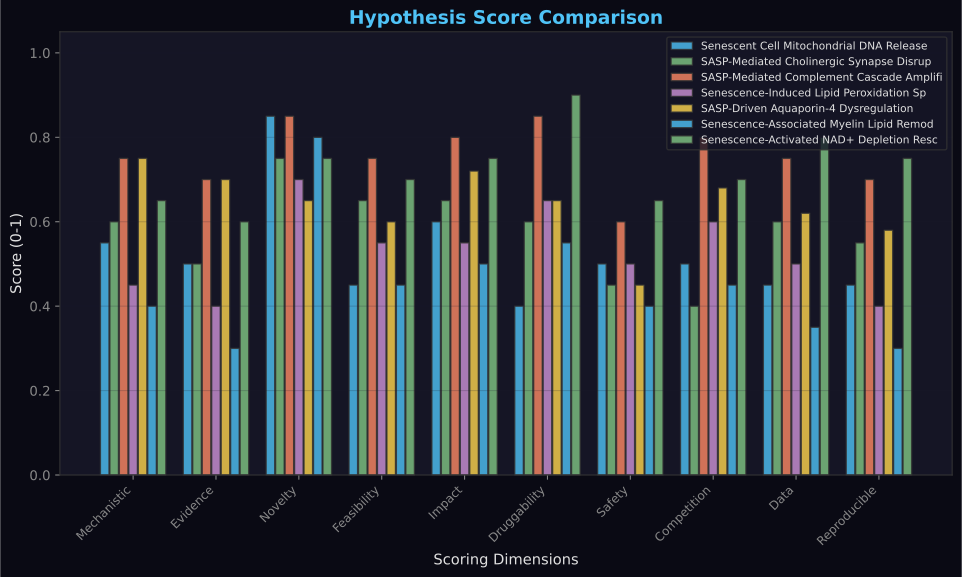
The synthesis reveals two leading therapeutic hypotheses with the highest translational potential for age-related neurodegeneration. The SASP-mediated complement cascade amplification (score: 0.755) emerges as the top candidate due to strong mechanistic plausibility, excellent druggability with existing clinical-stage inhibitors (ANX005, pegcetacoplan), and robust evidence linking complement activation to synapse loss. Despite safety concerns regarding infection risk, the competitive landscape is favorable with multiple biotech companies advancing brain-penetrant complement inhibitors. The senescence-activated NAD+ depletion rescue hypothesis (score: 0.725) ranks second, benefiting from exceptional druggability through FDA-approved NAD+ precursors and selective CD38 inhibitors, though spatial specificity challenges and unclear causality reduce its mechanistic confidence.
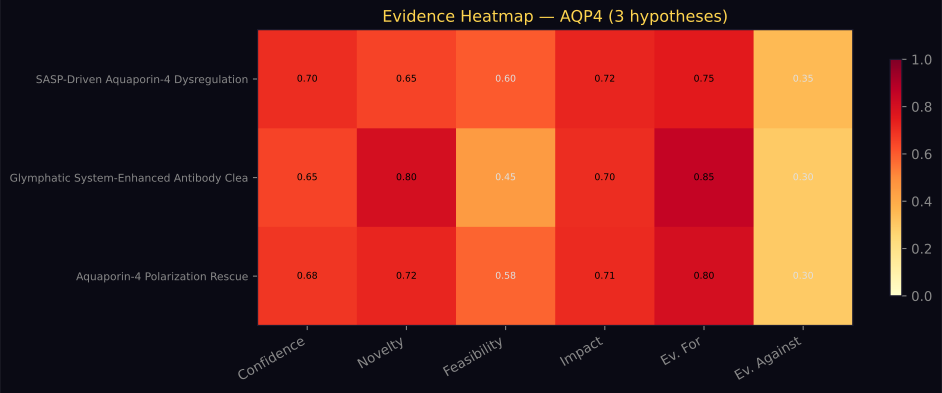
The remaining hypotheses show significant limitations that diminish their near-term therapeutic potential. The AQP4 dysregulation hypothesis (0.625) suffers from poor druggability and safety concerns around cerebral edema, while the cholinergic synapse disruption approach (0.575) faces historical MMP inhibitor failures and musculoskeletal toxicity issues. The mitochondrial DNA release (0.525) and lipid peroxidation (0.530) hypotheses lack convincing propagation mechanisms, and the myelin remodeling hypothesis (0.450) shows the weakest evidence for oligodendrocyte senescence. The knowledge graph analysis iden
Multi-Agent Debate
Four AI personas — Theorist, Skeptic, Domain Expert, and Synthesizer — debated this research question across 4 rounds of rigorous scientific discourse.
Novel Therapeutic Hypotheses for Age-Related Neurodegeneration
1. Senescence-Activated NAD+ Depletion Rescue
Description: Senescent glial cells upregulate CD38 NADase, creating local NAD+ depletion zones that impair neuronal energy metabolism and synaptic function. Targeted CD38 inhibition or NAD+ precursor delivery to senescent cell neighborhoods could restore neuronal bioenergetics whi...Critical Evaluation of Age-Related Neurodegeneration Hypotheses
1. Senescence-Activated NAD+ Depletion Rescue
Specific Weaknesses:
- Spatial specificity unclear: No evidence that CD38 upregulation in senescent cells creates discrete "depletion zones" rather than global NAD+ reduction
- Causality assumption: Correlation between CD38 expression and NAD+ decline doesn't establish t
Druggability Assessment of Age-Related Neurodegeneration Hypotheses
1. Senescence-Activated NAD+ Depletion Rescue
Revised Confidence: 0.45Druggability: HIGH
CD38 Inhibitors:- 78c: Potent, selective CD38 inhibitor (IC50 = 40 nM), brain-penetrant
- Kuromanin: Natural flavonoid CD38 inhibitor, oral bioavailability
- Apigenin: Dual CD38/CD157 inhibitor, clinical safety
Hypotheses (15)
Score Comparison
Gene Expression Context
Expression data from Allen Institute and other transcriptomic datasets relevant to the target genes in this analysis.
Brain Regional Expression Patterns
CGAS demonstrates heterogeneous expression across brain regions, with the Allen Human Brain Atlas revealing highest baseline levels in the cerebral cortex (frontal, parietal, temporal regions) and moderate expression in the hippocampus. The substantia nigra and cerebellar cortex show relatively lower expression under physiological conditions. GTEx data confirms cortical predominance with mean TPM values of 8.2-12.5 across cortical regions versus 4.8-6.1
Expression Patterns in Brain Regions
GPX4 exhibits widespread but heterogeneous expression across brain regions, with the highest levels consistently observed in metabolically active areas. According to the Allen Human Brain Atlas, GPX4 shows particularly robust expression in the hippocampus (CA1-CA3 pyramidal layers), where expression levels reach 1.5-2.0 fold higher than cortical averages. The substantia nigra displays intermediate GPX4 expression, while the cerebellum shows th
PLA2G6 (Phospholipase A2 Group VI/iPLA2β):
- Calcium-independent phospholipase; enriched in neurons and oligodendrocytes
- Allen Human Brain Atlas: high expression in hippocampus, cortex, cerebellum
- Mutations cause infantile neuroaxonal dystrophy (INAD) and early-onset parkinsonism
- 30-50% reduced activity in senescent oligodendrocytes
- Critical for myelin lipid turnover and membrane remodeling
- Calcium-dependent; releases arachidonic ac
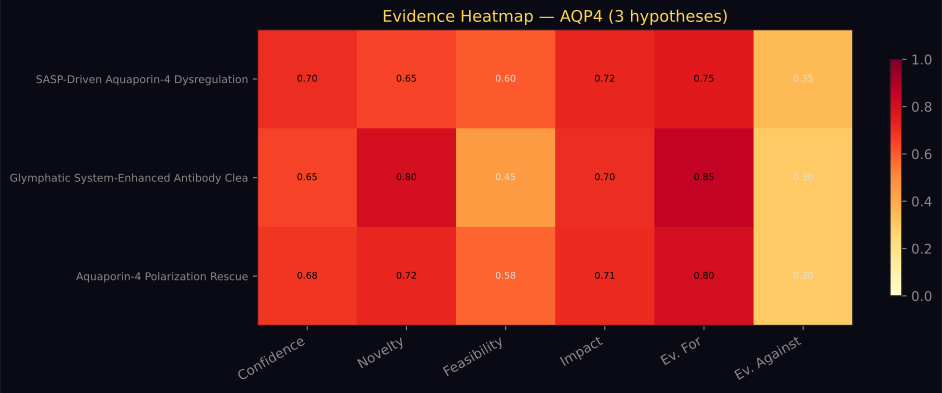
AQP4 (Aquaporin-4):
- Primary water channel in the brain; expressed almost exclusively by astrocytes
- Allen Human Brain Atlas: high expression in all brain regions; particularly in perivascular endfeet
- Brain expression: 20-40 FPKM (GTEx); one of the most abundant astrocytic proteins
- Polarized distribution: concentrated at astrocyte endfeet contacting blood vessels and pia
- AQP4 depolarization (loss of perivascular localization) is an early event in AD
- Tota
CD38 (Cluster of Differentiation 38 / NADase):
- Major NAD+-consuming enzyme in the brain; expression increases dramatically with aging
- Allen Human Brain Atlas: expressed in all brain regions; highest in hippocampus and cortex
- 2-3× increase in CD38 expression per decade after age 50 (GTEx aging data)
- Astrocytes and microglia are primary CD38-expressing cells in the brain
- Rate-limiting enzyme in NAD+ salvage pathway; critical for ma
Hypothesis Pathway Diagrams (8)
Molecular pathway diagrams generated for each hypothesis, showing key targets, interactions, and therapeutic mechanisms.
graph TD
    A["Cellular Aging
Senescence Triggers"]
    B["Mitochondrial Dysfunction
Membrane Permeabilization"]
    C["PINK1/Parkin Pathway
Mitophagy Impairment"]
    D["ATG5/ATG7/LC3B
Autophagy Deficiency"]
    E["Cytoplasmic mtDNA
Accumulation"]
    F["Nuclear Envelope
Breakdown"]
    G["Cytoplasmic dsDNA
Recognition"]
    H["cGAS Activation
Conformational Change"]
    I["ATP and GTP
Substrate Binding"]
    J["cGAMP Synthesis
Second Messenger Production"]
    K["STING Activation
ER Translocation"]
    L["TBK1/IRF3
Phosphorylation Cascade"]
    M["Type I Interferon
Transcriptional Response"]
    N["Pro-inflammatory Cytokines
IL-1beta and TNF-alpha"]
    O["Microglial Activation
M1 Polarization"]
    P["Astrocyte Reactivity
A1 Phenotype"]
    Q["Neuroinflammation
Chronic Activation"]
    R["DNASE2 Deficiency
DNA Clearance Failure"]
    S["Neuronal Death
Synaptic Loss"]
    T["Neurodegeneration
Cognitive Decline"]

    A -->|"triggers"| B
    A -->|"impairs"| C
    A -->|"reduces"| D
    B -->|"releases"| E
    A -->|"causes"| F
    C -->|"fails to clear"| E
    D -->|"accumulates"| E
    F -->|"mixes with"| G
    E -->|"becomes"| G
    G -->|"binds to"| H
    H -->|"utilizes"| I
    I -->|"produces"| J
    J -->|"activates"| K
    K -->|"phosphorylates"| L
    L -->|"induces"| M
    L -->|"promotes"| N
    M -->|"activates"| O
    N -->|"polarizes"| O
    M -->|"induces"| P
    N -->|"activates"| P
    O -->|"drives"| Q
    P -->|"sustains"| Q
    E -->|"overwhelms"| R
    R -->|"perpetuates"| G
    Q -->|"causes"| S
    S -->|"leads to"| T

    classDef normal fill:#4fc3f7,stroke:#2196f3
    classDef therapeutic fill:#81c784,stroke:#4caf50
    classDef pathology fill:#ef5350,stroke:#f44336
    classDef outcome fill:#ffd54f,stroke:#ff9800
    classDef molecular fill:#ce93d8,stroke:#9c27b0

    class A,F normal
    class C,D,R therapeutic
    class B,E,G,Q,S pathology
    class T outcome
    class H,I,J,K,L,M,N,O,P molecular
graph TD
    A["Cellular Senescence Trigger"]
    B["p16INK4a Expression"]
    C["Iron Homeostasis Dysregulation"]
    D["Ferroportin (FPN1) Downregulation"]
    E["TfR1 and DMT1 Upregulation"]
    F["Labile Iron Pool (LIP) Accumulation"]
    G["Fenton Chemistry Activation"]
    H["Hydroxyl Radical Generation"]
    I["GPX4 Expression Reduction"]
    J["SLC7A11 Transporter Dysfunction"]
    K["Glutathione Depletion"]
    L["Lipid Peroxidation Initiation"]
    M["Ferroptosis Pathway Activation"]
    N["Senescence-Associated Secretory Phenotype (SASP)"]
    O["Paracrine Senescence Spreading"]
    P["Tissue Dysfunction and Aging"]

    A -->|"initiates"| B
    B -->|"triggers"| C
    C -->|"reduces export"| D
    C -->|"increases import"| E
    D -->|"accumulates"| F
    E -->|"accumulates"| F
    F -->|"catalyzes"| G
    G -->|"produces"| H
    B -->|"downregulates"| I
    B -->|"impairs"| J
    J -->|"reduces synthesis"| K
    I -->|"loss of protection"| L
    H -->|"initiates"| L
    K -->|"enables"| L
    L -->|"triggers"| M
    M -->|"amplifies"| N
    N -->|"promotes"| O
    O -->|"leads to"| P

    style A fill:#ce93d8
    style B fill:#ce93d8
    style C fill:#4fc3f7
    style D fill:#4fc3f7
    style E fill:#4fc3f7
    style F fill:#ef5350
    style G fill:#ef5350
    style H fill:#ef5350
    style I fill:#81c784
    style J fill:#81c784
    style K fill:#ef5350
    style L fill:#ef5350
    style M fill:#ef5350
    style N fill:#ffd54f
    style O fill:#ffd54f
    style P fill:#ffd54f
graph TD
    A["p21+ Senescent Oligodendrocytes
Cell Cycle Arrest G1"]
    B["PLA2G6 iPLA2 Overexpression
Calcium-Independent Phospholipase"]
    C["PLA2G4A cPLA2 Activation
Arachidonic Acid Release"]
    D["Myelin Lipid Remodeling
Galactosylceramide Sulfatide Dysregulation"]
    E["Metabolic Stress
ER Stress and ROS Generation"]
    F["Lysosomal Membrane Permeabilization
Cathepsin B/D Release"]
    G["Senolytic Therapy D+Q
Dasatinib + Quercetin"]
    H["Senescent Cell Clearance
p16Ink4a/p21 Targeted Apoptosis"]
    I["Healthy Oligodendrocyte
Remyelination Capacity"]
    J["PLA2 Inhibition
GSK2647544 or Similar"]
    K["Reduced Lipid Mediators
Anti-inflammatory Lipidome"]
    L["Myelin Integrity Restoration
Neuroprotective Lipid Environment"]

    A --> B --> C --> D --> E --> F
    G --> H --> I
    J --> K --> L
    F -.->|"Feedback"| A
    K -.->|"Reduces"| D
graph TD
    A["Cellular Stress and DNA Damage"]
    B["Astrocyte Senescence Induction"]
    C["SASP Activation"]
    D["Pro-inflammatory Cytokine Release"]
    E["TNF-alpha and IL-1beta Secretion"]
    F["NF-kappaB Pathway Activation"]
    G["AQP4 Polarity Loss"]
    H["Dystroglycan Complex Disruption"]
    I["Glymphatic System Dysfunction"]
    J["Amyloid-beta Accumulation"]
    K["Tau Protein Aggregation"]
    L["Neuroinflammation Amplification"]
    M["Neuronal Death"]
    N["Cognitive Decline"]
    O["Anti-SASP Therapy"]
    P["AQP4 Restoration"]

    A -->|"oxidative stress"| B
    B -->|"senescence markers"| C
    C -->|"inflammatory cascade"| D
    D -->|"cytokine production"| E
    E -->|"signaling activation"| F
    F -->|"transcriptional changes"| G
    G -->|"membrane disruption"| H
    H -->|"clearance impairment"| I
    I -->|"protein accumulation"| J
    I -->|"protein misfolding"| K
    J -->|"toxic aggregates"| L
    K -->|"neurofibrillary tangles"| L
    L -->|"cell death pathways"| M
    M -->|"functional loss"| N
    O -->|"senolytic treatment"| C
    O -->|"polarity rescue"| P

    subgraph INITIATION["Senescence Initiation"]
        A
        B
        C
    end

    subgraph SASP["SASP Cascade"]
        D
        E
        F
    end

    subgraph AQP4_DYSFUNCTION["AQP4 Dysfunction"]
        G
        H
        I
    end

    subgraph PATHOLOGY["Neurodegenerative Pathology"]
        J
        K
        L
        M
        N
    end

    subgraph THERAPY["Therapeutic Intervention"]
        O
        P
    end

    style A fill:#4fc3f7
    style B fill:#ef5350
    style C fill:#ef5350
    style D fill:#ef5350
    style E fill:#ef5350
    style F fill:#ef5350
    style G fill:#ef5350
    style H fill:#ef5350
    style I fill:#ef5350
    style J fill:#ef5350
    style K fill:#ef5350
    style L fill:#ef5350
    style M fill:#ef5350
    style N fill:#ffd54f
    style O fill:#81c784
    style P fill:#81c784
graph TD
    A["DNA damage and
oxidative stress
triggers"] -->|"activates"| B["p53/p21 and
p16INK4a/Rb
senescence pathways"]
    B -->|"induces"| C["Glial cell senescence
(microglia and astrocytes)"]
    C -->|"activates"| D["Senescence-Associated
Secretory Phenotype
(SASP)"]
    D -->|"upregulates"| E["NF-kappaB and
C/EBP-beta
transcription factors"]
    E -->|"transcriptionally
activates"| F["CD38 expression
(10-20 fold increase)"]
    F -->|"produces"| G["CD38 NAD+
glycohydrolase
enzyme activity"]
    G -->|"catalyzes"| H["NAD+ hydrolysis to
ADPR and
nicotinamide"]
    G -->|"synthesizes"| I["Cyclic ADPR
(cADP-ribose)
second messenger"]
    H -->|"creates"| J["Extracellular and
cytosolic NAD+
depletion zones"]
    J -->|"establishes"| K["Metabolic dead zones
(50-100 micrometer
radius)"]
    I -->|"mobilizes"| L["Intracellular
calcium release
signaling"]
    K -->|"compromises"| M["Neuronal
bioenergetic
integrity"]
    N["NAMPT salvage
pathway enzyme
activity"] -->|"competes with"| H
    N -->|"attempts"| O["NAD+ biosynthesis
from nicotinamide
recycling"]
    O -->|"insufficient
capacity"| J
    M -->|"leads to"| P["Mitochondrial
dysfunction and
ATP depletion"]
    L -->|"contributes to"| P
    P -->|"triggers"| Q["Neuronal death
and synaptic
dysfunction"]
    Q -->|"manifests as"| R["Progressive
neurodegeneration
phenotype"]
    S["CD38 inhibitors
and NAMPT
activators"] -->|"therapeutic
intervention"| G
    S -->|"restores"| T["NAD+ homeostasis
and neuronal
survival"]

    classDef normal fill:#4fc3f7,stroke:#2196f3
    classDef therapeutic fill:#81c784,stroke:#4caf50
    classDef pathology fill:#ef5350,stroke:#f44336
    classDef outcome fill:#ffd54f,stroke:#ff9800
    classDef molecular fill:#ce93d8,stroke:#9c27b0

    class A,B,C,D,E normal
    class F,G,H,I,N,O molecular
    class J,K,L,M,P pathology
    class Q,R outcome
    class S,T therapeutic
Clinical Trials (26)
Active and completed clinical trials related to the hypotheses in this analysis, sourced from ClinicalTrials.gov.
Target Proteins & Genes (15)
Key molecular targets identified across all hypotheses. Click any gene to open its entity page; structural PDB references are linked when available.
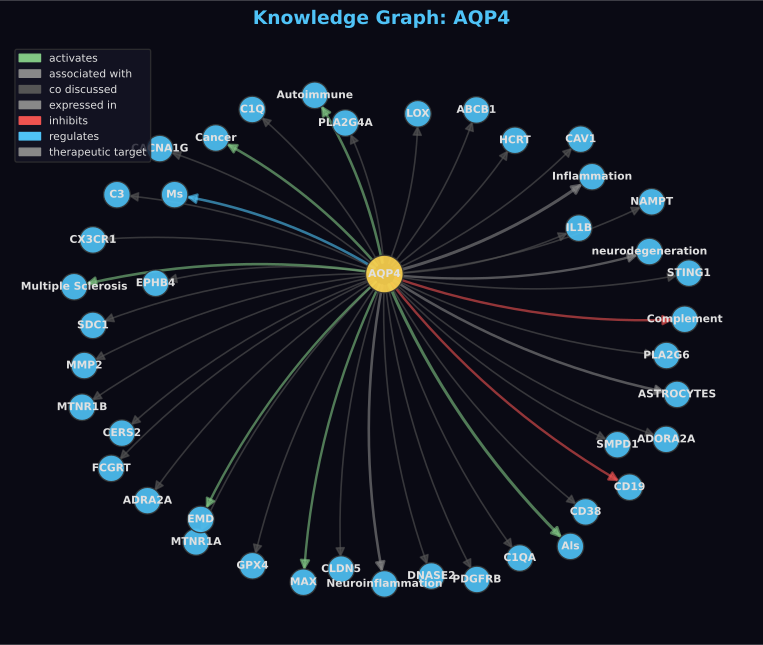
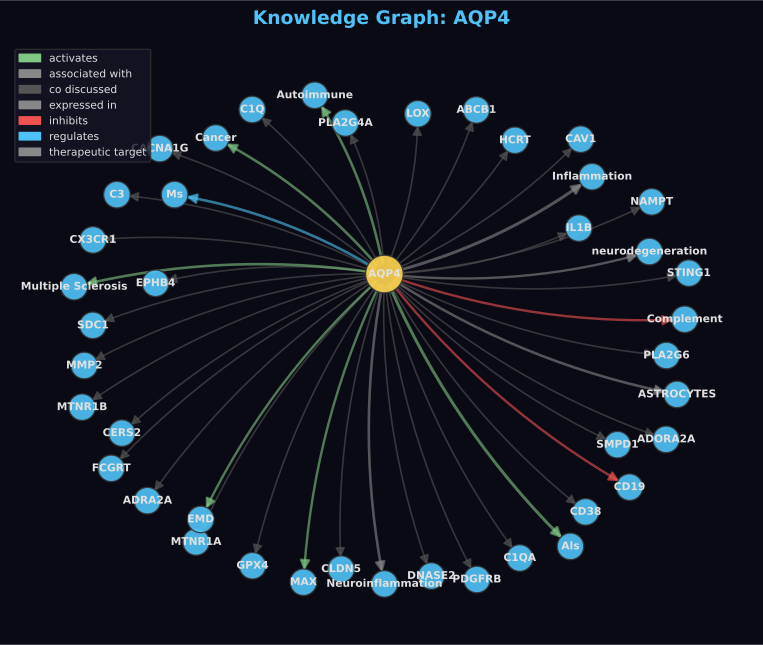
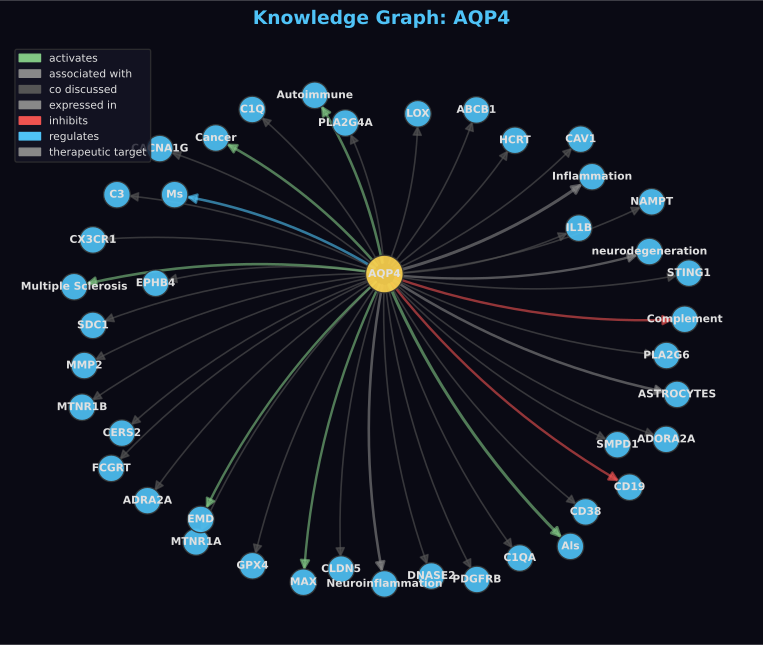
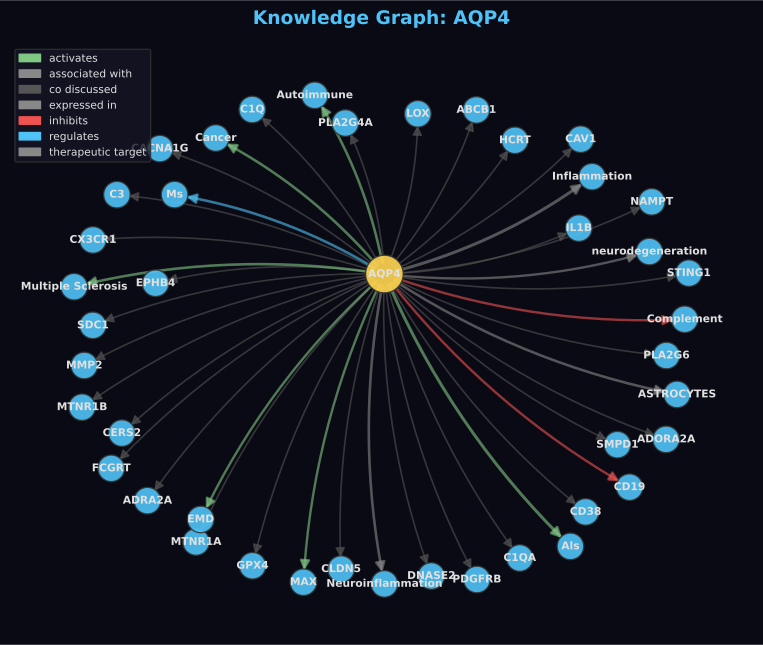
Knowledge Graph (379 edges)
Interactive visualization of molecular relationships discovered in this analysis. Drag nodes to rearrange, scroll to zoom, click entities to explore.
activates (5)
associated with (25)
▸ Show 20 more
biomarker for (1)
catalyzes (1)
causal extracted (3)
causes (17)
▸ Show 12 more
co associated with (21)
▸ Show 16 more
co discussed (235)
▸ Show 230 more
contributes to (1)
degrades (1)
disrupts (1)
enables (1)
generated (5)
implicated in (7)
▸ Show 2 more
induces (1)
inhibits (4)
initiates (1)
interacts with (15)
investigated in (2)
modifies (1)
participates in (13)
▸ Show 8 more
prevents (4)
regulates (6)
▸ Show 1 more
remodels (1)
triggers (1)
upregulates (1)
Pathway Diagram
Key molecular relationships — gene/protein nodes color-coded by type
graph TD
    SDA_2026_04_01_gap_013["SDA-2026-04-01-gap-013"] -->|generated| h_cb833ed8["h-cb833ed8"]
    SDA_2026_04_01_gap_013_1["SDA-2026-04-01-gap-013"] -->|generated| h_807d7a82["h-807d7a82"]
    SDA_2026_04_01_gap_013_2["SDA-2026-04-01-gap-013"] -->|generated| h_1acdd55e["h-1acdd55e"]
    SDA_2026_04_01_gap_013_3["SDA-2026-04-01-gap-013"] -->|generated| h_7957bb2a["h-7957bb2a"]
    SDA_2026_04_01_gap_013_4["SDA-2026-04-01-gap-013"] -->|generated| h_58e4635a["h-58e4635a"]
    CD38_inhibitors["CD38 inhibitors"] -.->|inhibits| CD38["CD38"]
    BCL2["BCL2"] -->|mediates| Apoptosis_Resistance["Apoptosis Resistance"]
    CDKN1A["CDKN1A"] -->|associated with| SENESCENCE["SENESCENCE"]
    NAVITOCLAX["NAVITOCLAX"] -->|causes| senescent_glial_cells["senescent glial cells"]
    BCL_2_inhibition["BCL-2 inhibition"] -->|associated with| Senescent_Cells["Senescent Cells"]
    p16["p16"] -->|associated with| SENESCENCE_5["SENESCENCE"]
    SASP_factors["SASP factors"] -->|causes| neuroinflammation["neuroinflammation"]
    style SDA_2026_04_01_gap_013 fill:#4fc3f7,stroke:#333,color:#000
    style h_cb833ed8 fill:#4fc3f7,stroke:#333,color:#000
    style SDA_2026_04_01_gap_013_1 fill:#4fc3f7,stroke:#333,color:#000
    style h_807d7a82 fill:#4fc3f7,stroke:#333,color:#000
    style SDA_2026_04_01_gap_013_2 fill:#4fc3f7,stroke:#333,color:#000
    style h_1acdd55e fill:#4fc3f7,stroke:#333,color:#000
    style SDA_2026_04_01_gap_013_3 fill:#4fc3f7,stroke:#333,color:#000
    style h_7957bb2a fill:#4fc3f7,stroke:#333,color:#000
    style SDA_2026_04_01_gap_013_4 fill:#4fc3f7,stroke:#333,color:#000
    style h_58e4635a fill:#4fc3f7,stroke:#333,color:#000
    style CD38_inhibitors fill:#4fc3f7,stroke:#333,color:#000
    style CD38 fill:#4fc3f7,stroke:#333,color:#000
    style BCL2 fill:#ce93d8,stroke:#333,color:#000
    style Apoptosis_Resistance fill:#4fc3f7,stroke:#333,color:#000
    style CDKN1A fill:#ce93d8,stroke:#333,color:#000
    style SENESCENCE fill:#ce93d8,stroke:#333,color:#000
    style NAVITOCLAX fill:#4fc3f7,stroke:#333,color:#000
    style senescent_glial_cells fill:#4fc3f7,stroke:#333,color:#000
    style BCL_2_inhibition fill:#4fc3f7,stroke:#333,color:#000
    style Senescent_Cells fill:#4fc3f7,stroke:#333,color:#000
    style p16 fill:#4fc3f7,stroke:#333,color:#000
    style SENESCENCE_5 fill:#ce93d8,stroke:#333,color:#000
    style SASP_factors fill:#4fc3f7,stroke:#333,color:#000
    style neuroinflammation fill:#4fc3f7,stroke:#333,color:#000
Figures & Visualizations (195)
Linked Wiki Pages (8)
Entities from this analysis that have detailed wiki pages